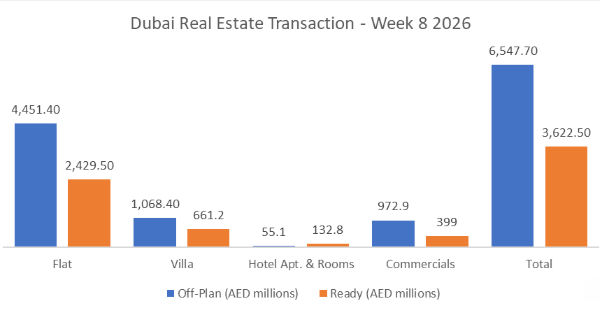
| Total trading reached AED 10.2 bn in Week 8 across 4,184 transactions. Off-Plan dominated with AED 6.5 bn (64.4%), while Ready accounted for AED 3.6 bn (35.6%). |
| Category |
Off-Plan (AED millions) |
Ready (AED millions) |
| Flat |
4,451.4 |
2,429.5 |
| Villa |
1,068.4 |
661.2 |
| Hotel Apt. & Rooms |
55.1 |
132.8 |
| Commercials |
972.9 |
399.0 |
| Total |
6,547.7 |
3,622.5 |
|
Off-Plan Market Performance
|
- Total Value: AED 6.5 bn
- Share of Weekly Total: 64.4%
|
| Sub-Category |
Value (AED millions) |
% of Off-Plan |
| Flat |
4,451.4 |
68.0% |
| Villa |
1,068.4 |
16.3% |
| Hotel Apt. & Rooms |
55.1 |
0.8% |
| Commercials |
972.9 |
14.9% |
|
| Off-plan activity was flat-led, with commercials providing a meaningful secondary contribution. |
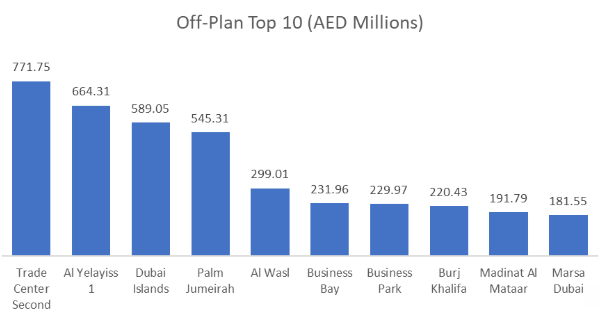
Top Performing Off-Plan Areas
|
| Top 10 areas generated AED 3.9 bn (59.9% of Off-Plan value). It’s worth mentioning that the Trade Center Second transaction was concentrated in AHS Tower (offices). |
| Area |
Value (AED millions) |
% of Off-Plan |
| Trade Center Second |
771.7 |
11.8% |
| Al Yelayiss 1 |
664.3 |
10.1% |
| Dubai Islands |
589.0 |
9.0% |
| Palm Jumeirah |
545.3 |
8.3% |
| Al Wasl |
299.0 |
4.6% |
|
Ready Market Performance
|
- Total Value: AED 3.6 bn
- Share of Weekly Total: 35.6%
|
| Sub-Category |
Value (AED millions) |
% of Ready |
| Flat |
2,429.5 |
67.1% |
| Villa |
661.2 |
18.3% |
| Hotel Apt. & Rooms |
132.8 |
3.7% |
| Commercials |
399.0 |
11.0% |
|
| Ready market performance also skewed strongly toward flats, with villas as the clear runner-up. |
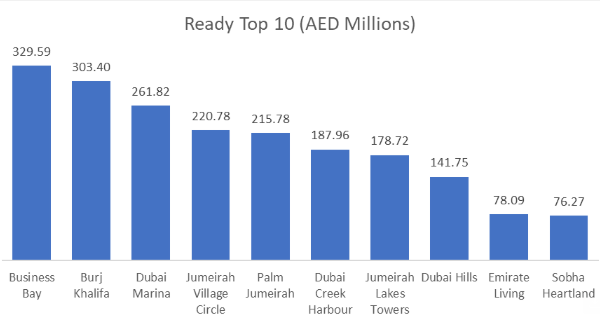
Top Performing Ready Areas
|
| Top 10 areas generated AED 2.0 bn (55.0% of Ready value). |
| Area |
Value (AED millions) |
% of Ready |
| Business Bay |
329.6 |
9.1% |
| Burj Khalifa |
303.4 |
8.4% |
| Dubai Marina |
261.8 |
7.2% |
| Jumeirah Village Circle |
220.8 |
6.1% |
| Palm Jumeirah |
215.8 |
6.0% |
|
On the micro level
Weekly Comparison
|
| Metric |
Last Week |
This Week |
Change |
| Total Value (AED bn) |
14.1 |
10.2 |
-3.9 bn (-27.9%) |
| Transactions |
5,481 |
4,184 |
-1,297 (-23.7%) |
|
Market Insights & Outlook
|
| Week 8 shows a broad cooling versus last week, with declines in both value (-27.9%) and transaction count (-23.7%), suggesting lower throughput, not just fewer large-ticket deals. Off-plan remained the market’s anchor at 64.4% of total value, and activity was highly concentrated: the top three off-plan areas (Trade Center Second, Al Yelayiss 1, Dubai Islands) delivered 30.9% of off-plan value, while the top three ready areas (Business Bay, Burj Khalifa, Dubai Marina) made up 24.7% of ready value. Palm Jumeirah featured in both segments’ top 10, reinforcing continued appetite for prime/coastal demand even during a softer weekly print. |
Source: Dubai Land Department
This report is an independent analysis published by MasidProperties for informational purposes.